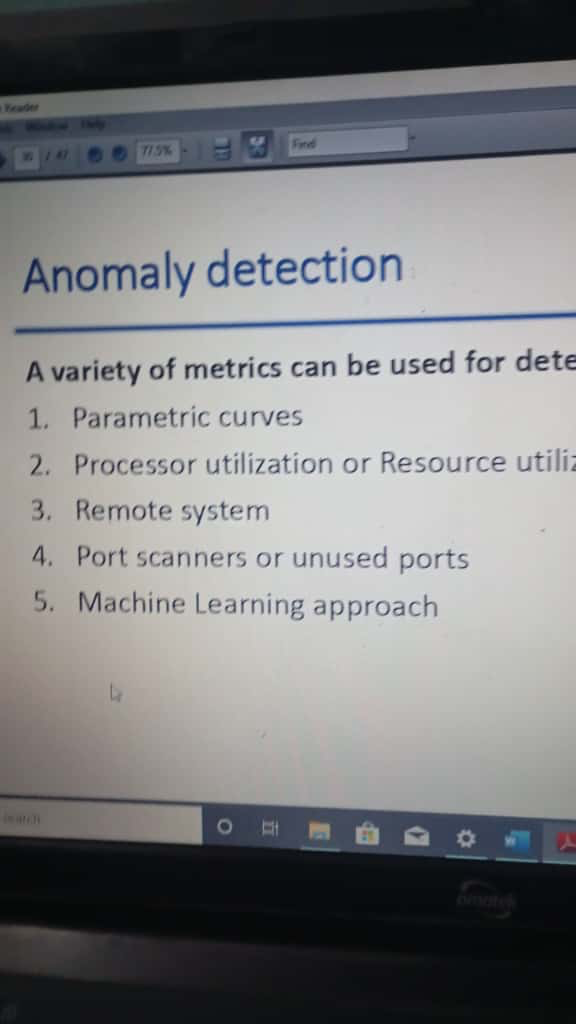
diagram of the following
Of course. Here is an explanation of Anomaly Detection, breaking down the different methods mentioned.
Anomaly Detection
Anomaly detection is the process of identifying data points, events, or observations that do not conform to an expected pattern or other items in a dataset. These non-conforming items are often referred to as anomalies, outliers, or exceptions. Think of it as finding a "needle in a haystack," where the needle is the unusual event and the haystack is the normal, everyday data.
This technique is widely used in various fields, such as detecting bank fraud, monitoring system health, identifying network security threats, and even in medical diagnoses. Let's look at some common approaches used to find these anomalies.
1. Statistical Methods (Parametric Curves)
One of the most straightforward ways to detect anomalies is by using statistics. If we can assume that the "normal" data follows a predictable pattern, like a bell curve (a Normal or Gaussian distribution), we can flag any data point that falls too far away from the center of that curve.
We measure this "farness" using standard deviations (σ). A common rule is that any point more than 2 or 3 standard deviations away from the average (mean) is a potential anomaly.
Interactive Bell Curve
Use the slider below to adjust the sensitivity (the standard deviation threshold). Observe how changing the threshold includes or excludes data points as anomalies. Points that fall outside the blue "normal" area are flagged in red.
2. Resource Utilization
In system monitoring, anomalies often appear as sudden changes in the usage of resources like the CPU, memory, or network bandwidth. A system might normally use 10-20% of its CPU power, but a sudden, sustained spike to 100% is an anomaly. This could indicate a software bug, a failing component, or even a malicious process like a cryptocurrency miner.
By tracking these metrics over time, we can establish a baseline of normal behavior and set up alerts for any significant deviations.
CPU Usage Monitor
Press the "Simulate" button to watch a mock real-time chart of CPU utilization. Notice the clear spike that represents an anomalous event.
3. Network Monitoring (Remote Systems & Ports)
In network security, anomalies can signal an attack. Two common examples are:
- Anomalous Remote Connections: A connection from an unknown IP address, or at an unusual time (like 3 AM), can be an anomaly. Monitoring which systems talk to each other helps establish a baseline of normal communication.
- Port Scanning: This is a technique used by attackers to discover vulnerable services on a system. They rapidly try to connect to a large number of network ports. An anomaly detection system can identify this behavior as it is very different from normal traffic, where a computer typically connects to only a few specific ports at a time.
Port Scan Detector
This visual represents a server's network ports. Green ports are active with normal traffic. Click "Run Simulation" to see normal traffic followed by a port scan attack, which is identified as an anomaly.
4. Machine Learning Approach
When patterns are too complex for simple statistics, Machine Learning (ML) models are used. These models can learn the intricate patterns of "normal" behavior from a large amount of historical data. Once trained, they can classify new data points as either normal or anomalous.
One common technique is clustering. The model groups the data into clusters of similar points. Any new data point that doesn't belong to any cluster is considered an outlier.
Interactive Anomaly Clustering
This chart shows a cluster of normal data points. The "Detect Anomalies" button will train a simple model that draws a boundary around this normal cluster. You can then click anywhere on the chart to add a new data point and see if the model classifies it as normal (blue) or an anomaly (red).